Text Link
Thank you! Your submission has been received!
Oops! Something went wrong while submitting the form.

Tick Chart vs Candlestick with MoonTrader

Discover what a tick chart is, how it differs from candlestick and time-based charts, and why scalpers prefer it for precise trading. Learn how MoonTrader’s tick chart helps you capture hidden market moves.
Tick сhart
Candlestick
Time chart
Moontrader Team
August 30, 2025

Introduction: Why Candles Hide Movements

Scalpers often notice that a candlestick chart shows only the background but not the actual sequence of trades. As a result, entries or stops may look “random.”

The reason is simple: candlesticks are time charts, aggregating price over fixed intervals, which masks important micro-movements.

A tick chart in trading works differently. Instead of time, each bar forms after a set number of trades. This way, you see the real order flow — the “heartbeat” of the market. For scalpers and day traders, this makes it one of the best chart types for scalping strategies.

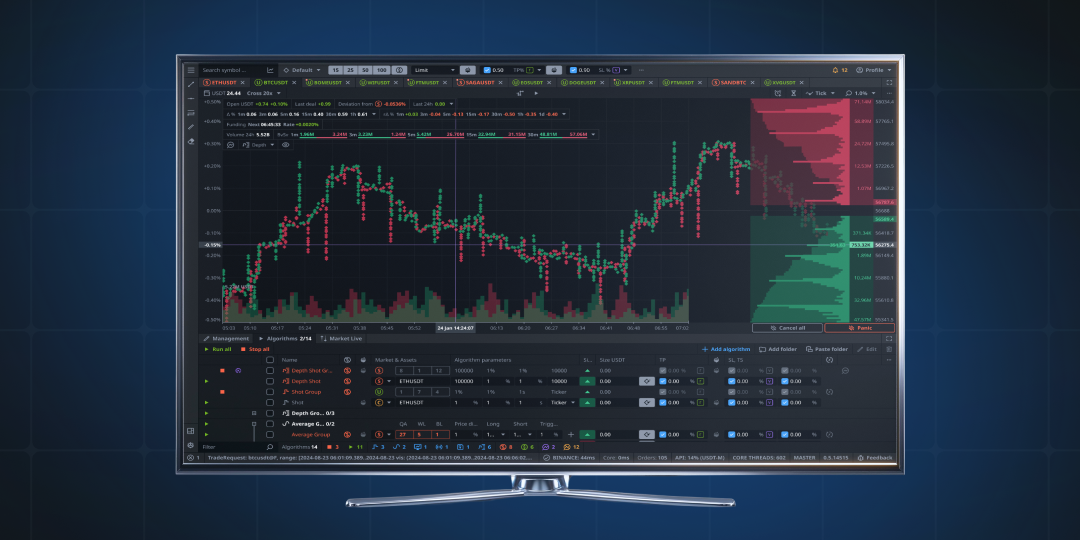
In MoonTrader, the tick chart is implemented with low latency and a cloud archive — combined with other terminal features, this makes it not just visualization but a powerful trading tool.

What Is a Tick Chart (and How It Differs from Time Charts)

What is a tick chart?

  • A tick = every change in the last traded price.

  • Each bar builds after a set number of trades.

  • The chart accelerates during high activity and slows down during quiet periods.

Candlestick / time chart:

  • Aggregates price movement over fixed intervals (1s, 1m, etc.).

  • Smooths over the inner structure of price action.

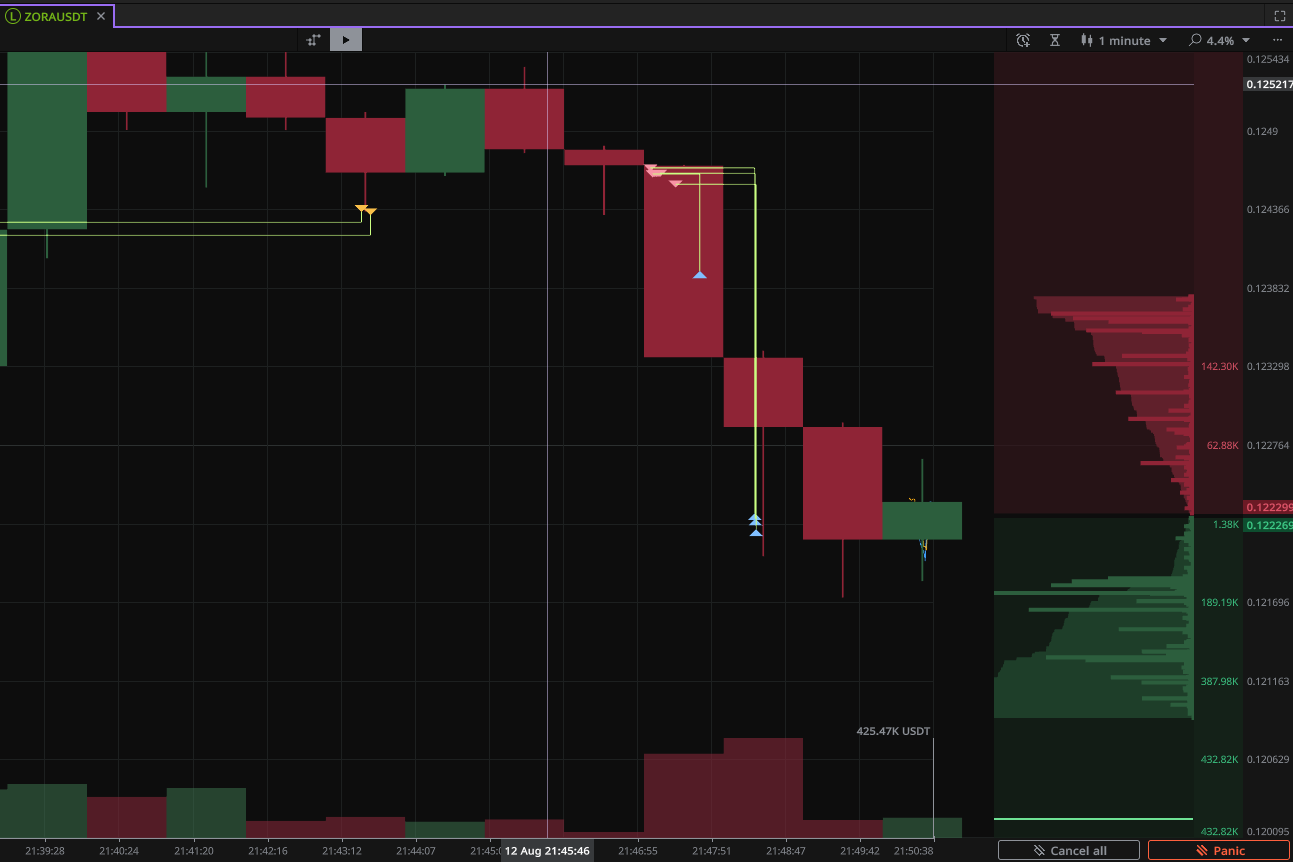
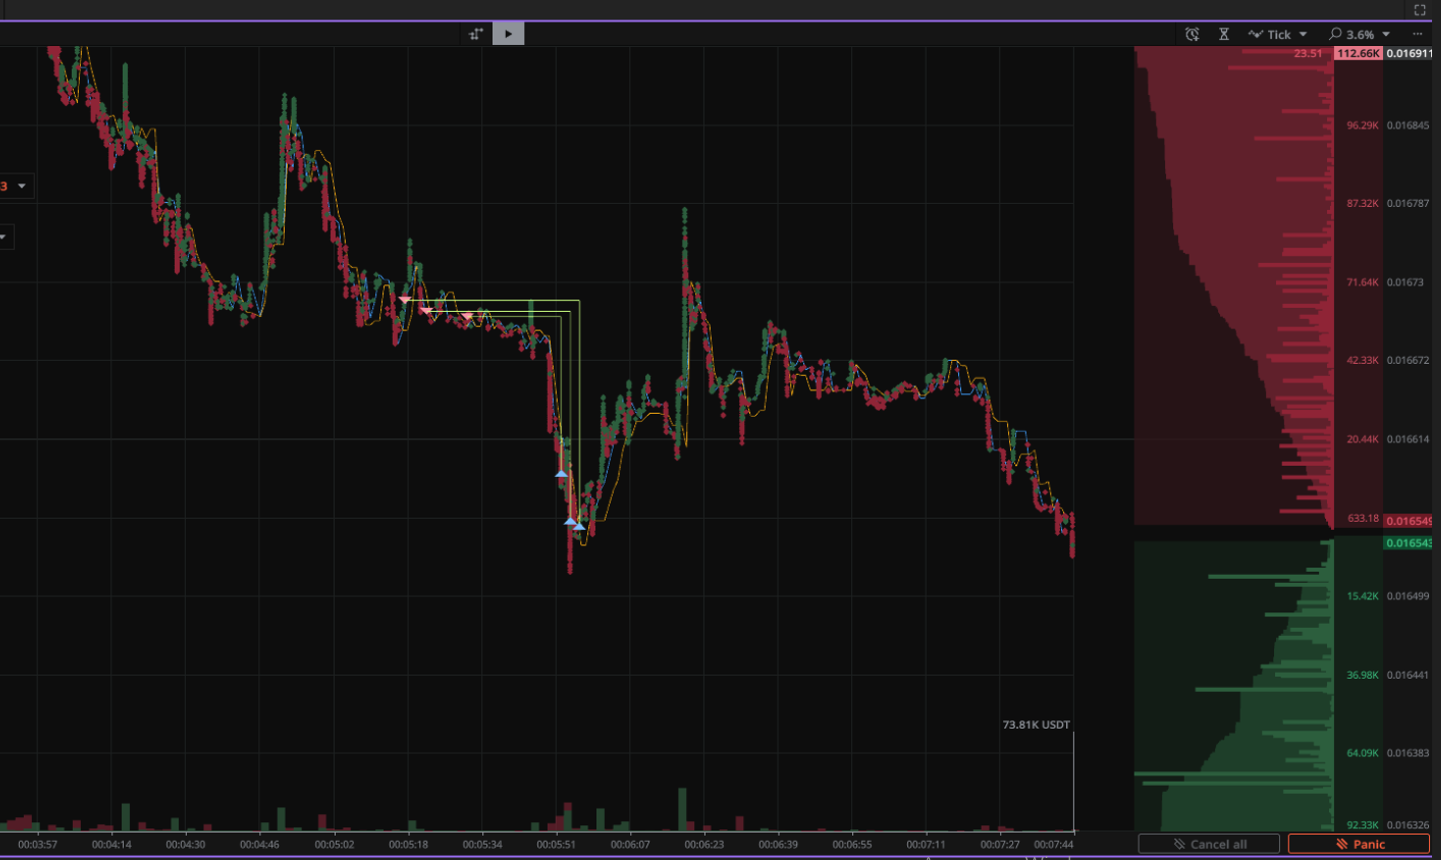
📊 Screenshot 1. Tick vs candlestick in the same trade
On one-minute candles only the overall background is visible, while the tick chart shows price dynamics more clearly — allowing a precise capture of the start of the move.

Tick Chart vs Candlestick Chart: Key Differences
Criterion Tick Chart Candlestick Chart (Time Chart)
Time reference No — built on each trade/price change Yes — built over fixed intervals
Detail level Very high, every move visible Averaged, hides intra-candle moves
Update speed Depends on market activity Constant, by timeframe
Micro-movements Clear view of structure Only final bar visible
Scalping suitability Excellent for entries/exits Limited, due to averaging
Trade post-analysis Frame-by-frame via tick history Only aggregated results
Slippage & spikes Easy to see Often hidden

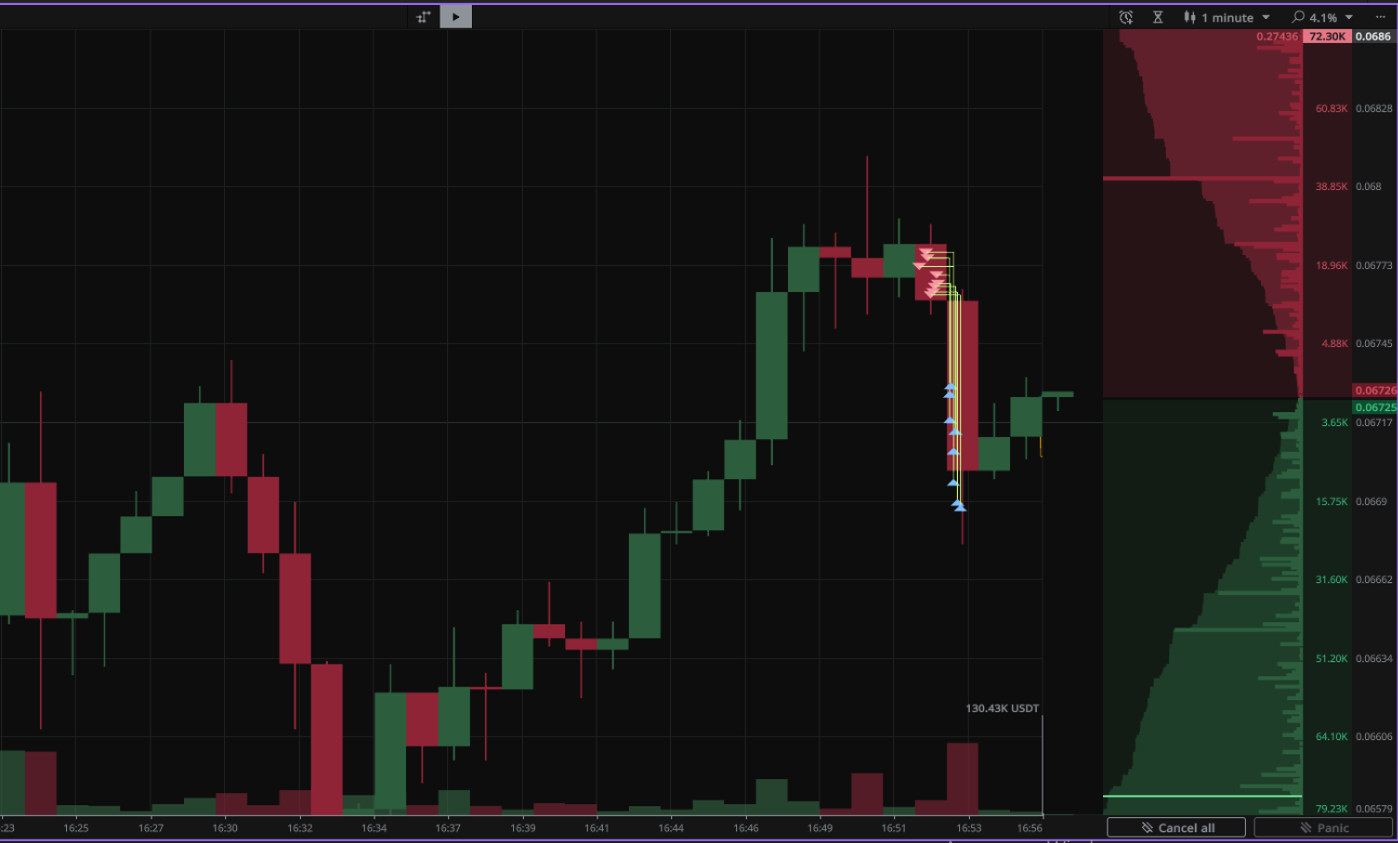
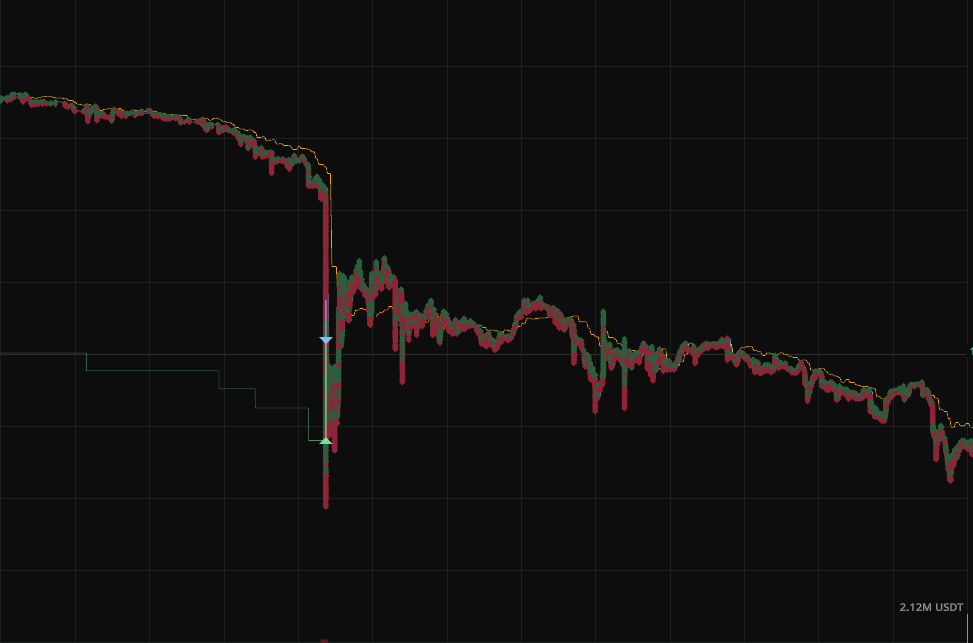
📊 Screenshot 2. Same trade on a candlestick vs tick chart
The tick chart reveals micro short spikes and price compression at the level before the drop — invisible on the candlestick.

Why Candlestick Charts Are Often “Blind”

  • Averaging hides the exact acceleration or slowdown point.

  • Hard to know if the candle formed smoothly or through sharp bursts.

  • Post-analysis shows only results, not the sequence of trades that caused them.

Tick Chart and Scalping Cryptocurrencies

For scalpers, a tick chart trading setup can be game-changing. Unlike time charts, it reacts to real activity, making it one of the best tick chart tools for scalping crypto.

3 Key Advantages for Scalping:

1. Microstructure visibility
Slowdowns, accelerations, reversals, steps near levels.

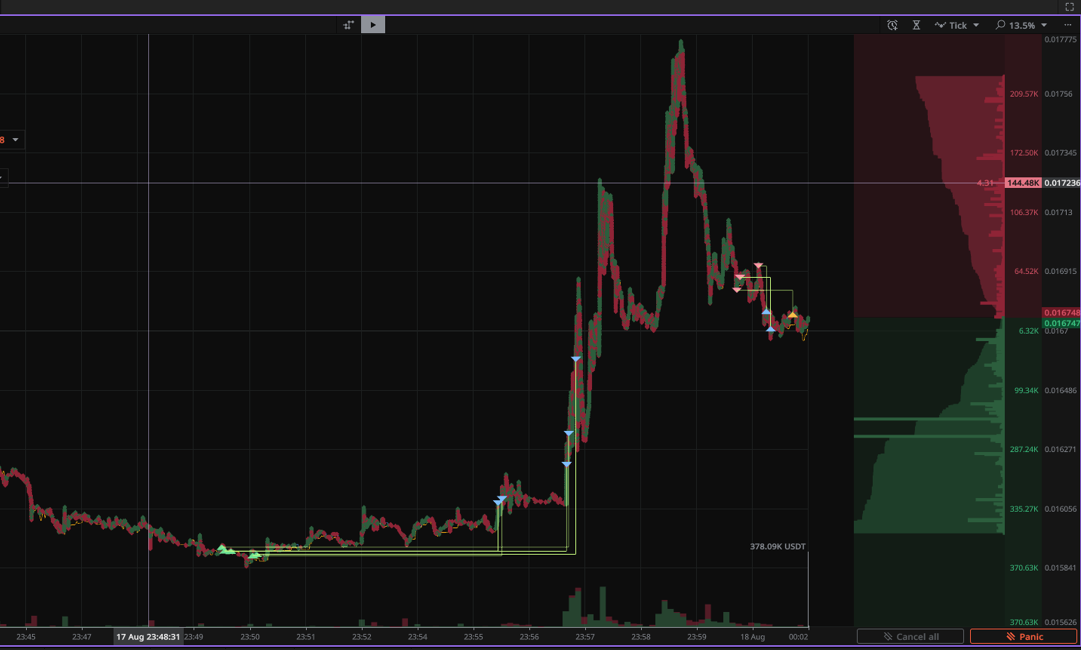
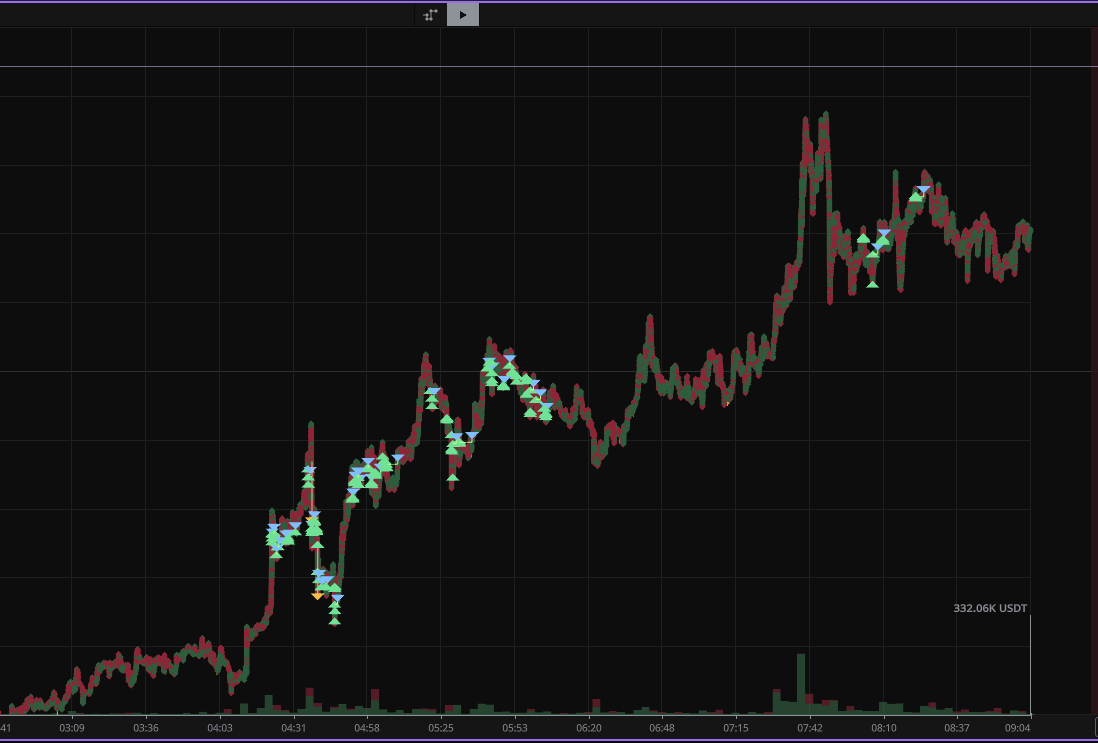
📊 Screenshot 3. Catching a reversal more precisely on the tick chart


2. Precise entries and exits
You can see where the impulse breaks or stalls. Perfect for scalping strategies that rely on timing.

📊 Screenshot 4. Start of a trend move

3. Anomaly detection
False breakouts and tick spikes that candles smooth over.

📊 Screenshot 5. Local short entry in trend

The Value of Tick Charts for Algorithms

For algorithmic trading, tick charts are not just a tool for execution but also for post-trade analysis.

  • Identify the exact entry and exit.

  • See why stops triggered.

  • Evaluate whether more profit was possible.

📊 Screenshot 6. Post-analysis of a short trade
The tick chart shows that the algorithm could have squeezed more profit with a wider distance.

Strategy diagnostics

  • Detect slippage and one-off spikes.

  • Study reactions to large limit orders.

  • Analyze micro-events where strategies fail.

📊 Screenshot 7. Volatility capture by the Shots algorithm

How MoonTrader Implements Tick Charts

  • Tick chart built directly in the terminal.

  • Zoom into any section.

  • Cloud tick history for detailed analysis.

  • Linked with triggers and algorithm controls.

  • Low-latency core for high-frequency and scalping trading.

When to Use Tick vs Candlestick

  • Candlesticks (time charts): context, levels, daily/hourly background.

  • Tick charts: scalping, entries/exits, algorithm debugging.

  • Best practice: candlesticks for strategy, tick charts for precision.

FAQ

1. What is a tick chart in trading?
A chart built on each trade or price change, not time.

2. How does it differ from time charts?
Candlesticks smooth movement over time, while tick charts show every trade.

3. Who should use tick charts?
Scalpers, day traders, and algorithmic traders.

4. Why does MoonTrader offer cloud tick history?
For trade reviews, finding strategy flaws, and improving exits.

5. Can you use tick charts and candlesticks together?
Yes — candles for context, ticks for scalping precision.

Conclusion

A tick chart shows the real heartbeat of the market. Instead of smoothing activity into time bars, it reveals the sequence of trades. For scalpers, this means sharper entries; for algorithms, fewer blind spots.

With MoonTrader’s tick chart software, traders gain instant visualization, cloud history, and low-latency execution — making it one of the best tick chart setups for day trading and scalping.

👉 Try trading for a couple of days watching both candlesticks and ticks side by side — you’ll feel the difference.

Check us out on

To learn more

The latest news, technology and resources from our team.
Tick сhart
Candlestick
Time chart

Tick Chart vs Candlestick with MoonTrader

Discover what a tick chart is, how it differs from candlestick and time-based charts, and why scalpers prefer it for precise trading. Learn how MoonTrader’s tick chart helps you capture hidden market moves.
Moontrader Team
Aug 30, 2025
WSOT
Bybit
Tournament

Join the Moontrader Team at WSOT 2025 by Bybit

WSOT 2025 is the largest trading tournament on Bybit. Teams compete based on P&L% and share a total prize pool of up to 3,600,000 USDT. We’re building our own squad and inviting traders to join!
Moontrader Team
Aug 18, 2025
Features
Tips
Settings

Moontrader Features for Smart Trading

We explain how to optimize your trading using Moontrader's built-in tools. Part 4.
Moontrader Team
Jul 24, 2025
Trading terminal free
Bonuses
Referral Links

Moontrader for Free – Step-by-Step Guide 2025

Get everything you need to activate the unlimited license of Moontrader and start saving on trading fees at Binance, Bybit, and OKX. It only takes six simple steps to get your license, plus enjoy up to 30% off trading commissions.
Moontrader Team
Jun 28, 2025

© 2024 MTSS Development OU, Estonia. All rights reserved.

Disclaimer: Moontrader is not a regulated entity. Trading involves substantial risks, and past performance is not indicative of future results. The profits shown in product screenshots are for illustrative purposes and may be exaggerated. Only engage in trading if you possess sufficient knowledge. Under no circumstances shall Moontrader accept any liability to any person or entity for (a) any loss or damage, in whole or in part, caused by, arising out of, or in connection with transactions involving our software or (b) any direct, indirect, special, consequential, or incidental damages. By using Moontrader's services, you acknowledge and accept the inherent risks involved in trading and agree to hold Moontrader harmless from any liabilities or losses incurred. It is essential to review and understand our Terms of Service and Risk Disclosure Policy before using our software or engaging in any trading activities. Please consult legal and financial professionals for personalized advice based on your specific circumstances.
All trademarks and copyrights belong to their respective owners. MoonTrader ecosystem is a registered trademark of MTSS Development OU, Estonia.

Terms of Use

Privacy Policy